ggplot(iris, aes(x = Species, y = Sepal.Length)) +
  geom_violin() +
  geom_boxplot(width = 0.1) +
  geom_jitter(size = 1, shape = 1, width = 0.15) +
  xlab('Species') +
  ylab('Sepal Length (cm)')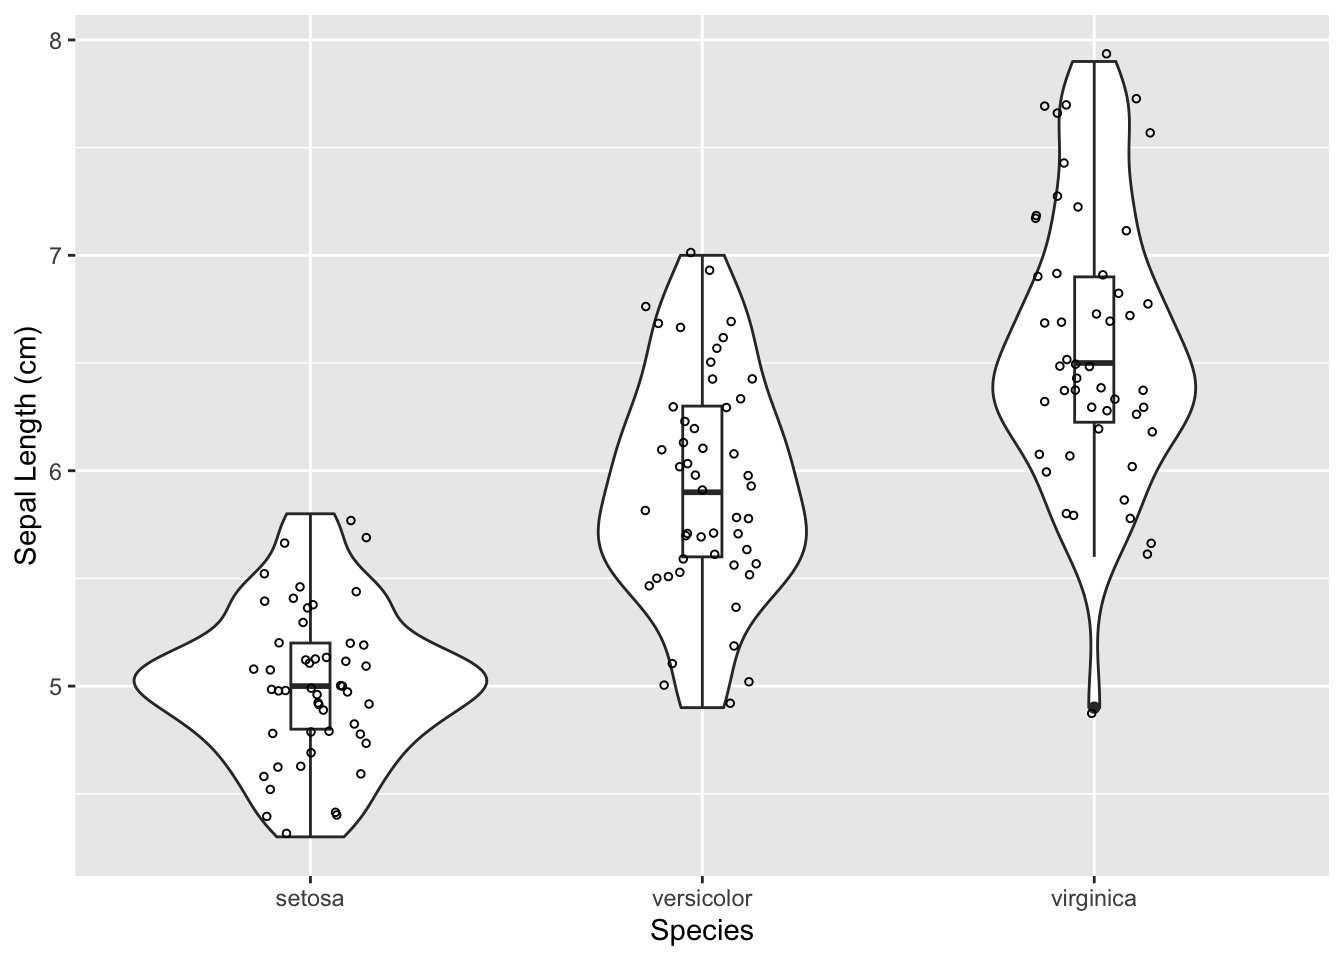
This is a non-parametric alternative to a one-way ANOVA test, so it makes no assumptions about the data’s parameters (like the mean, sd, variance, etc). This should be used when you’re comparing the medians of more than two independent groups, and the assumptions for ANOVA are not met.
Here is an example of using the Kruskal-Wallis test to test whether the sepal length (cm) of 3 species of flowers from the iris dataset is different among the species. This is a built-in dataset in R and does not need to be loaded. It is commonly used for data science demonstrations.
We could visualize our data using a boxplot or violin plot (or both), the same as for an ANOVA test.
ggplot(iris, aes(x = Species, y = Sepal.Length)) +
geom_violin() +
geom_boxplot(width = 0.1) +
geom_jitter(size = 1, shape = 1, width = 0.15) +
xlab('Species') +
ylab('Sepal Length (cm)')
We could also visualize the descriptive statistics for the dataset. kable() is used to format the output into a markdown table, and it is available in the knitr package.
iris %>%
  group_by(Species) %>%
  summarize(
    Count = length(Sepal.Length),
    Min = min(Sepal.Length),
    Max = max(Sepal.Length),
    Mean = mean(Sepal.Length),
    SD = sd(Sepal.Length),
    SEM = SD/sqrt(Count),
    Median = median(Sepal.Length),
    IQR = IQR(Sepal.Length)
  ) %>%
kable(digits = 3)| Species | Count | Min | Max | Mean | SD | SEM | Median | IQR |
|---|---|---|---|---|---|---|---|---|
| setosa | 50 | 4.3 | 5.8 | 5.006 | 0.352 | 0.050 | 5.0 | 0.400 |
| versicolor | 50 | 4.9 | 7.0 | 5.936 | 0.516 | 0.073 | 5.9 | 0.700 |
| virginica | 50 | 4.9 | 7.9 | 6.588 | 0.636 | 0.090 | 6.5 | 0.675 |
The test assumes that the frequency distributions of measurements have the same shape among groups. We can check this using a histogram.
iris %>%
  ggplot(aes(x = Sepal.Length)) +
  geom_histogram(bins = 10) +
  facet_wrap(~ Species) +
  xlab('Sepal Length (cm)') +
  ylab('Frequency')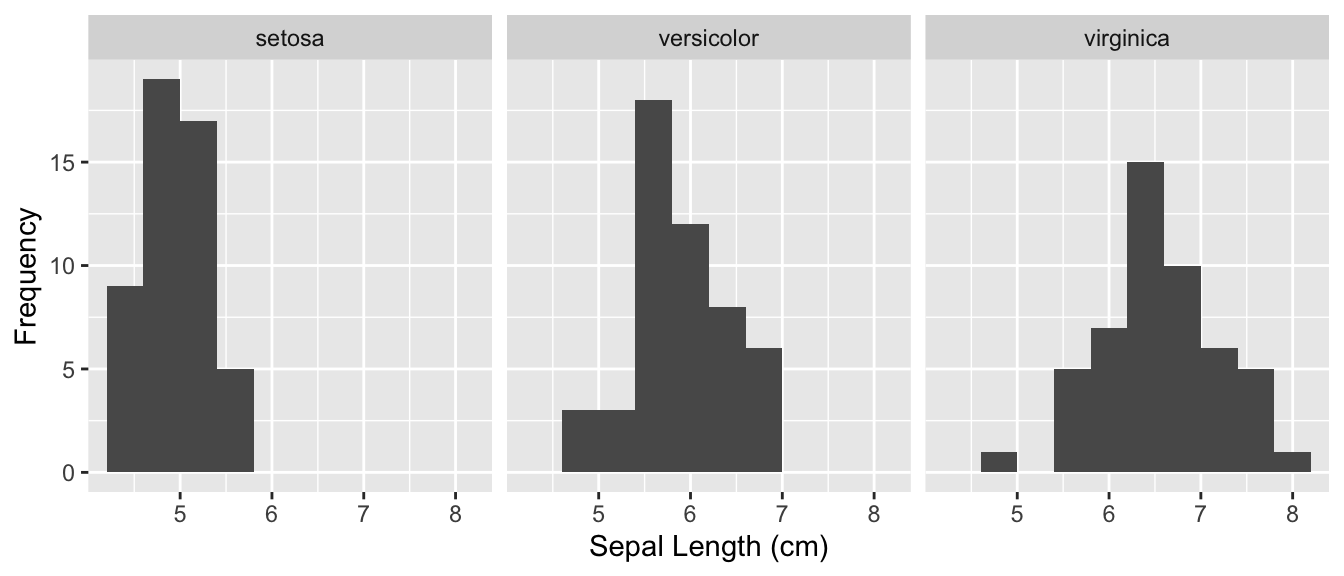
We can use the built-in kruskal.test method in R to perform this test.
kruskal.test(Sepal.Length ~ Species, data = iris)
    Kruskal-Wallis rank sum test

data:  Sepal.Length by Species
Kruskal-Wallis chi-squared = 96.937, df = 2, p-value < 2.2e-16
Since we have a really low P-value (P-value < 0.001), we can reject the null hypothesis. At least one species has a different median (and originates from a different distribution) than the rest.